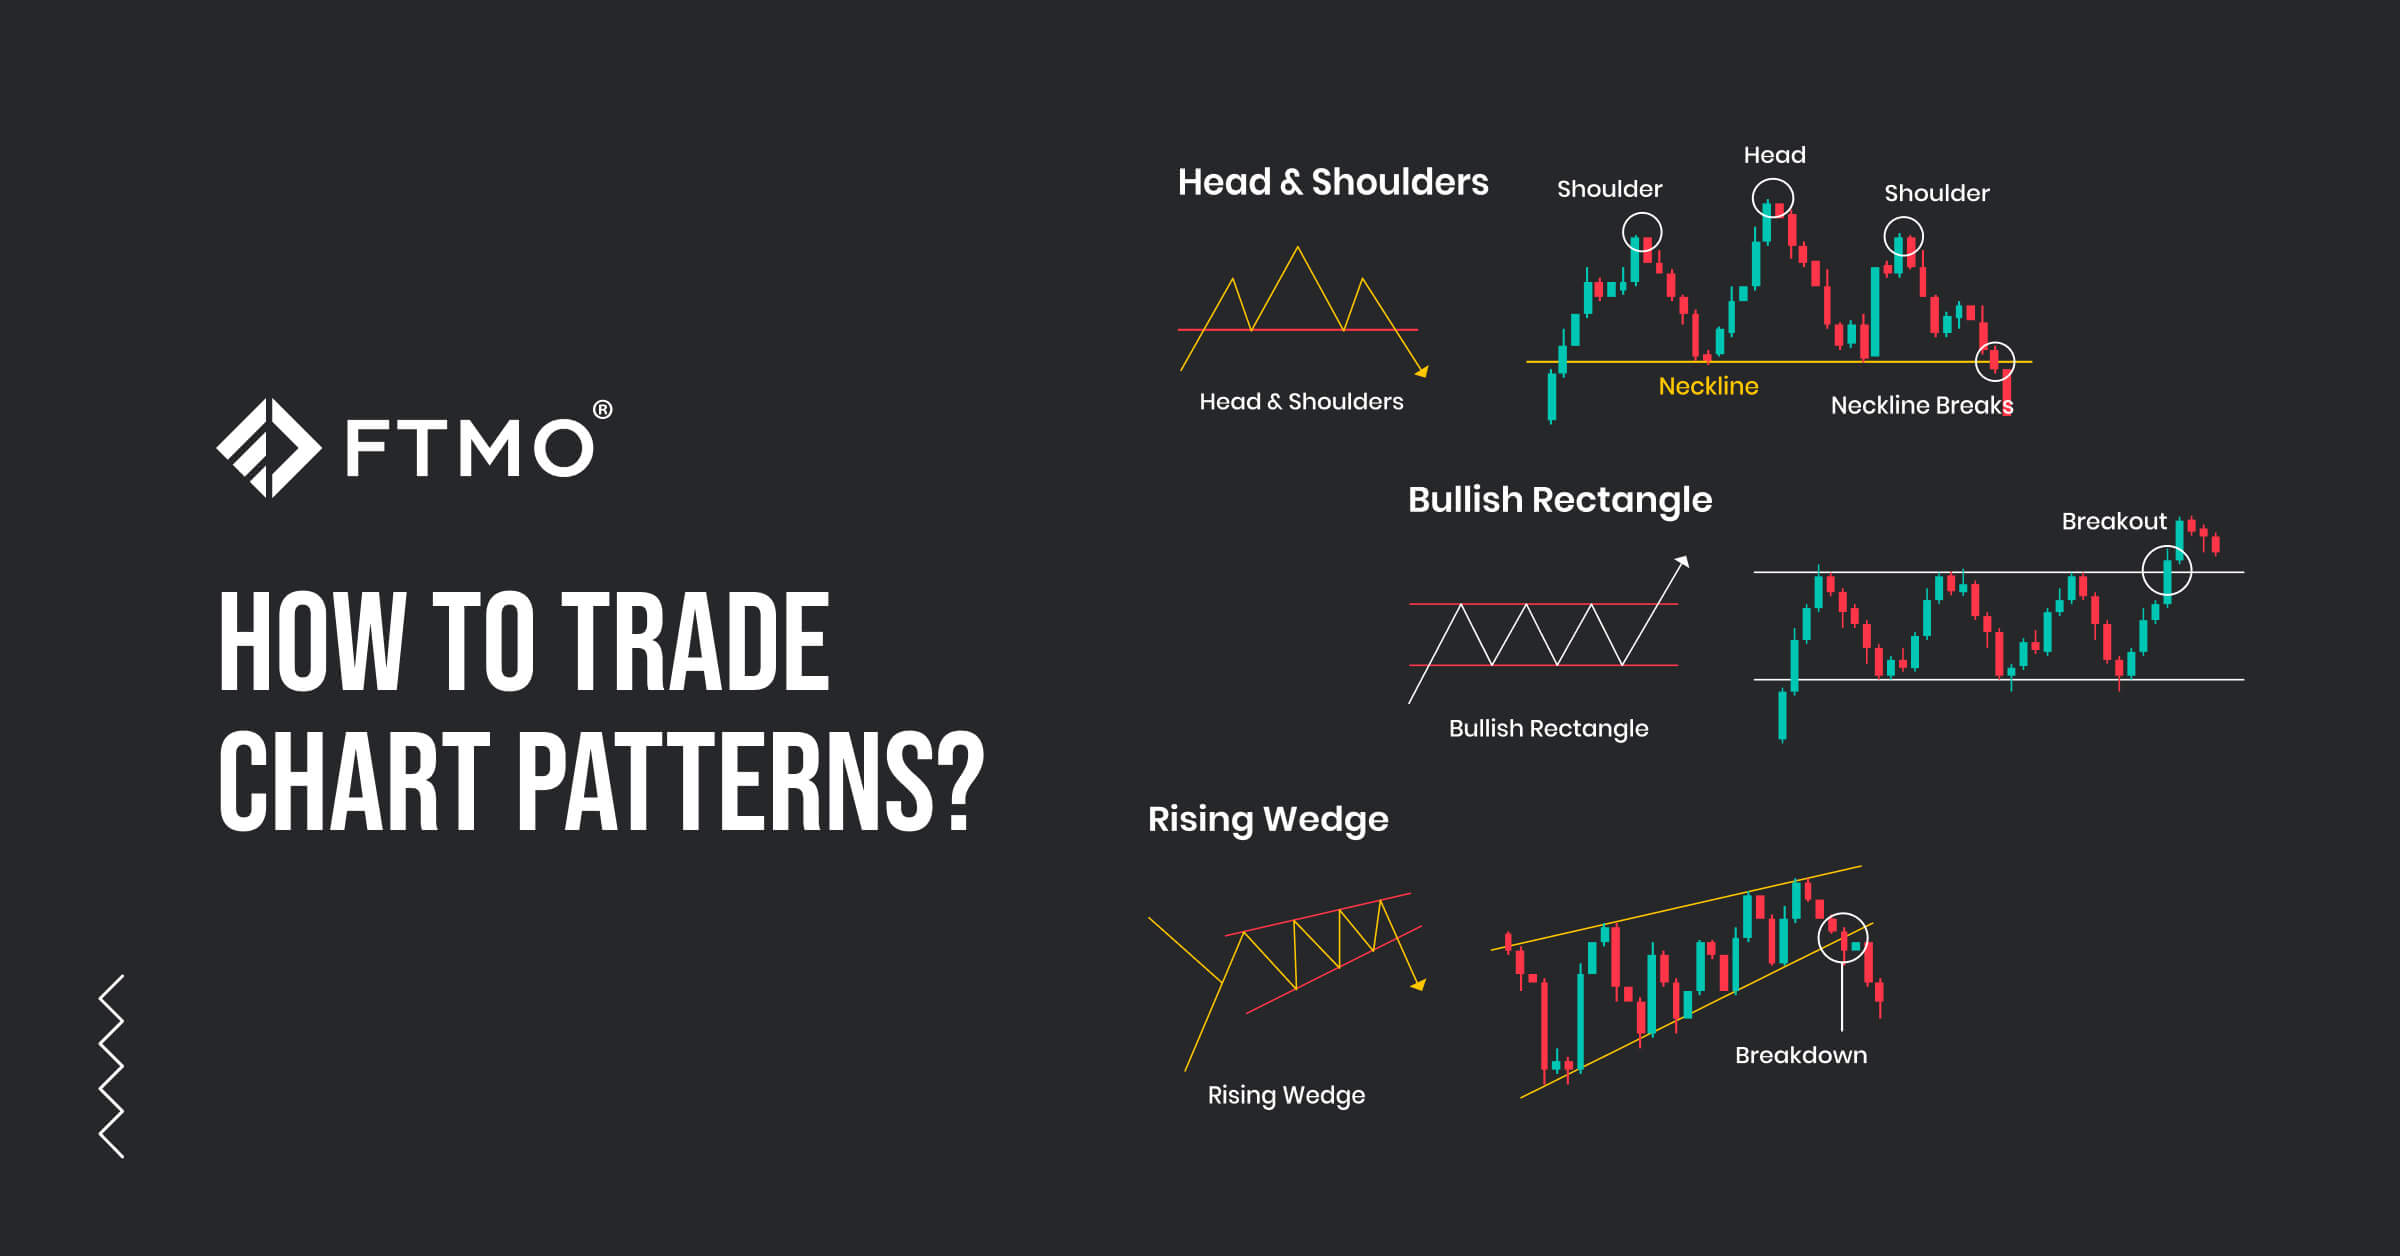
How to Trade Chart Patterns?
Have you ever looked at the chart and had a feeling of déjà vu? A feeling that the chart or candlestick pattern is repeating itself in some way? This is because certain movements in the market keep repeating, and for this reason, there are candlestick and chart patterns. Their history dates back to the very first discovery of Japanese candlesticks, and nowadays they are a necessary part of technical analysis.
On the internet, you may find unlimited information and study materials on this matter, and although there may be slight differences in each of the explanations, it is important to understand the most basic ones. In this article, we will discuss the most popular chart patterns that you can include in your trading strategy.
Reversal Chart Patterns
Reversal chart patterns signal potential turning points in the price action, helping traders identify buying and selling opportunities. They are formed by price action and trading volume, and some of the most common include head and shoulders, double top/bottom, and triple top/bottom. Each has a distinct shape and can offer trade opportunities when the price breaks out of the formation. However, they should never be used in isolation but rather as part of broader technical analysis.
Double Top/Bottom
A double top occurs when an asset’s price forms two consecutive peaks at roughly the same level, with a valley in between. The peaks highlight resistance, and the valley is called the “neckline.” A break below the neckline confirms the bearish reversal, usually after an uptrend has exhausted buyers.
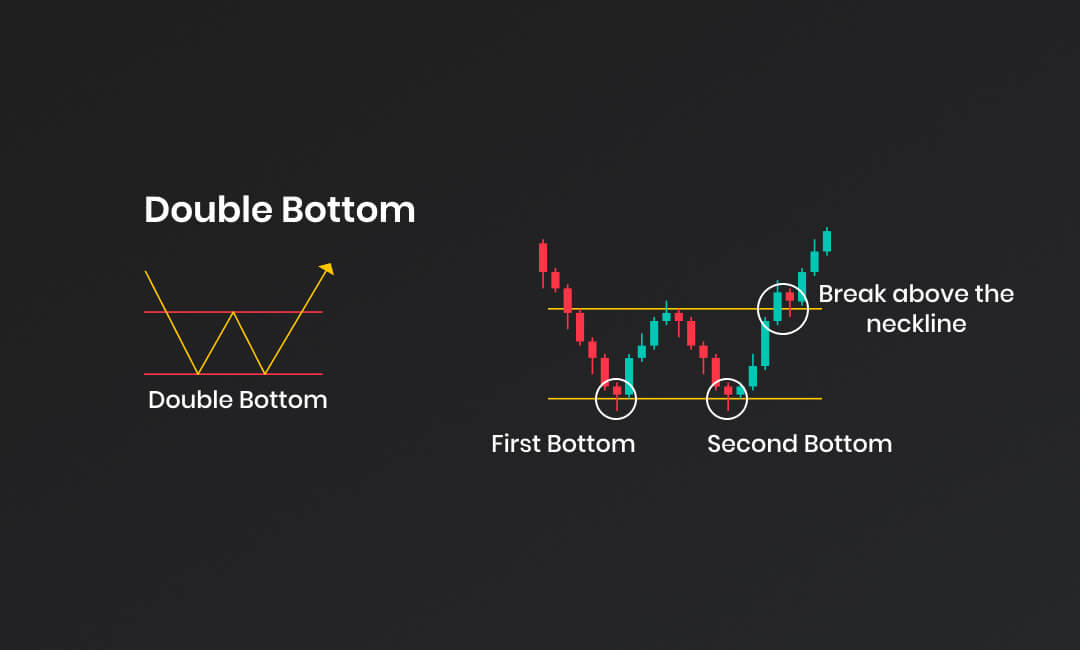
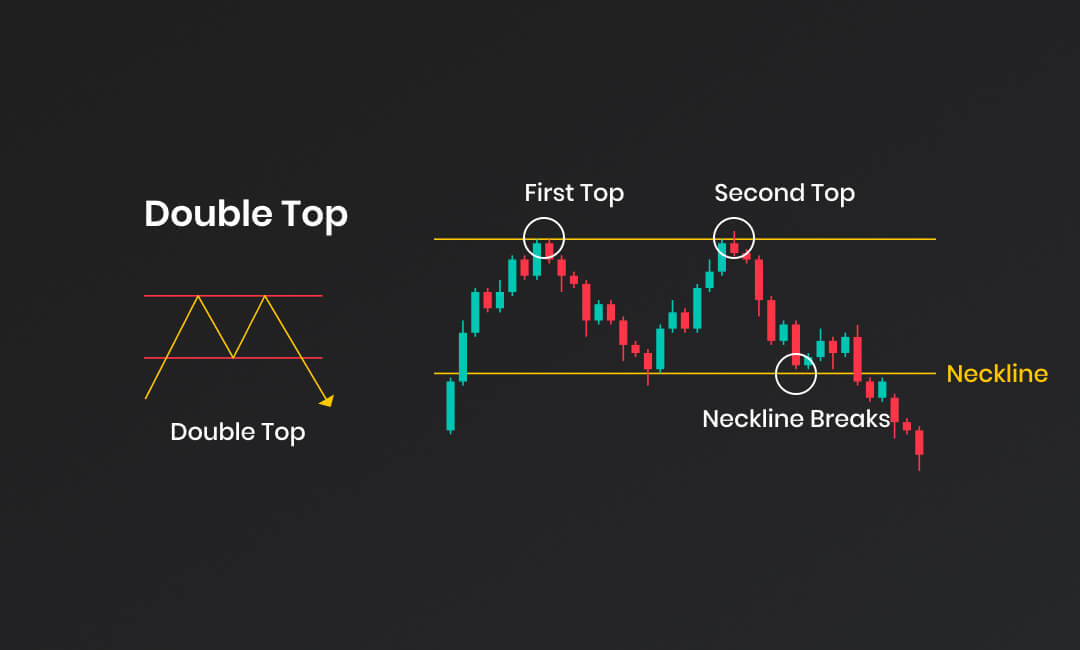 A double bottom forms the opposite pattern—a “W” shape—where price hits two troughs at a similar level, separated by a peak. A break above this peak signals a bullish reversal, showing that buyers are regaining control.
Triple Top/Bottom
A triple top consists of three peaks at a similar level, followed by a break below support, suggesting sellers have taken control. Confirmation often comes when the price breaks the support again and falls below the previous low.
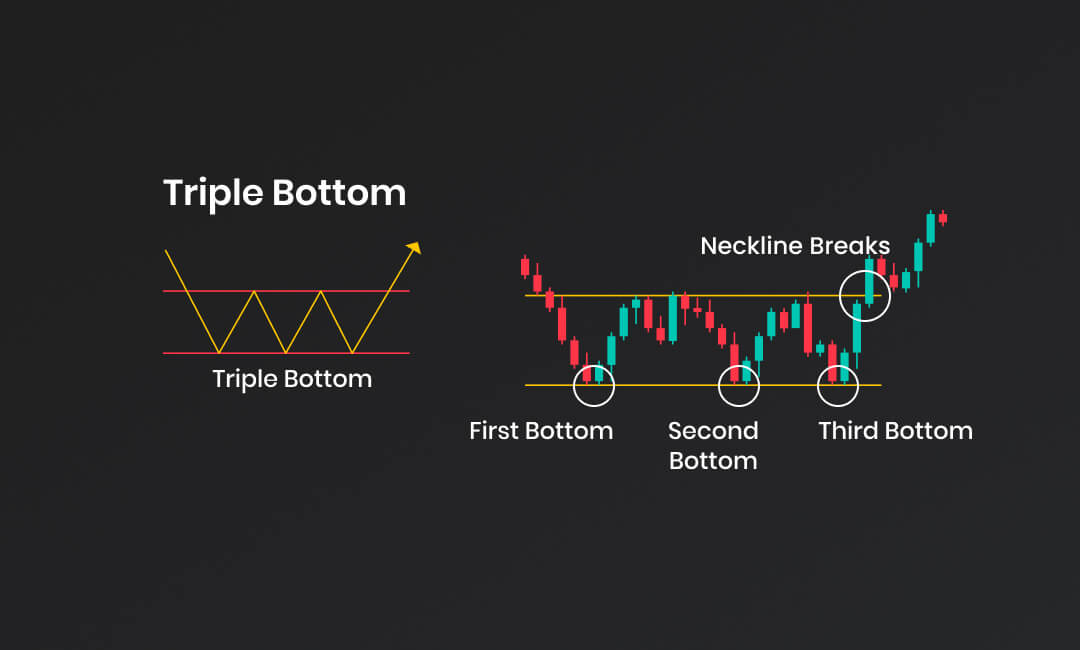
A triple bottom mirrors this pattern with three troughs at a comparable level. It shows repeated attempts by sellers to push the price down, but strong buying pressure halts the decline. A break above resistance confirms the bullish reversal.
Head & Shoulders
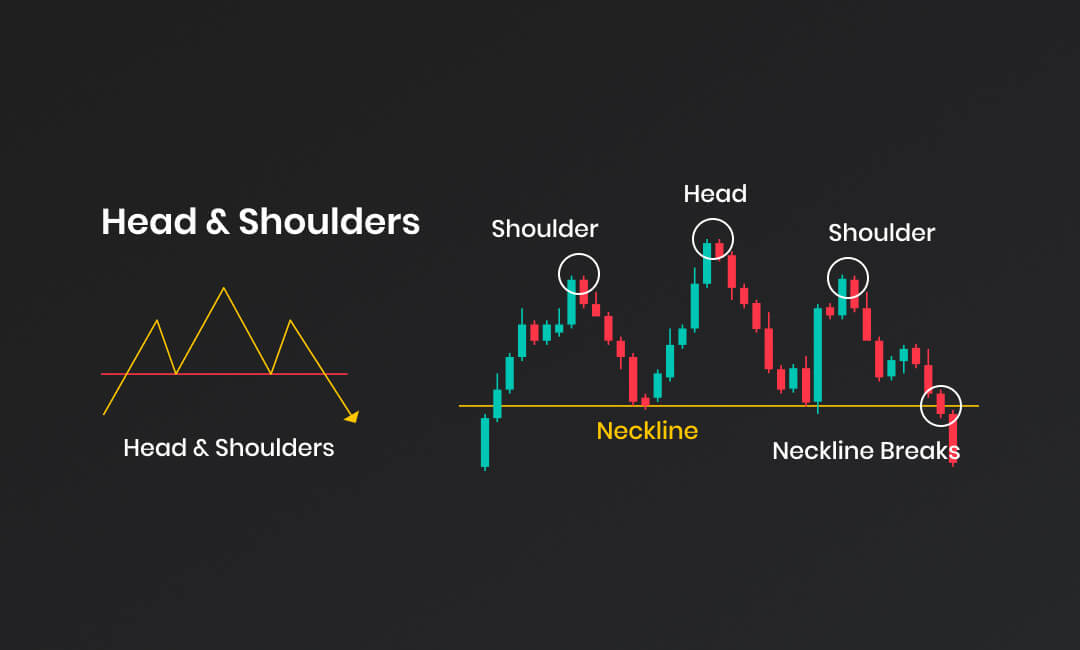
The head and shoulders pattern has three peaks: two smaller shoulders on each side of a higher head. A neckline drawn through the valleys confirms the structure. When the price drops below the neckline, it signals a bearish reversal.
Inverted Head & Shoulders
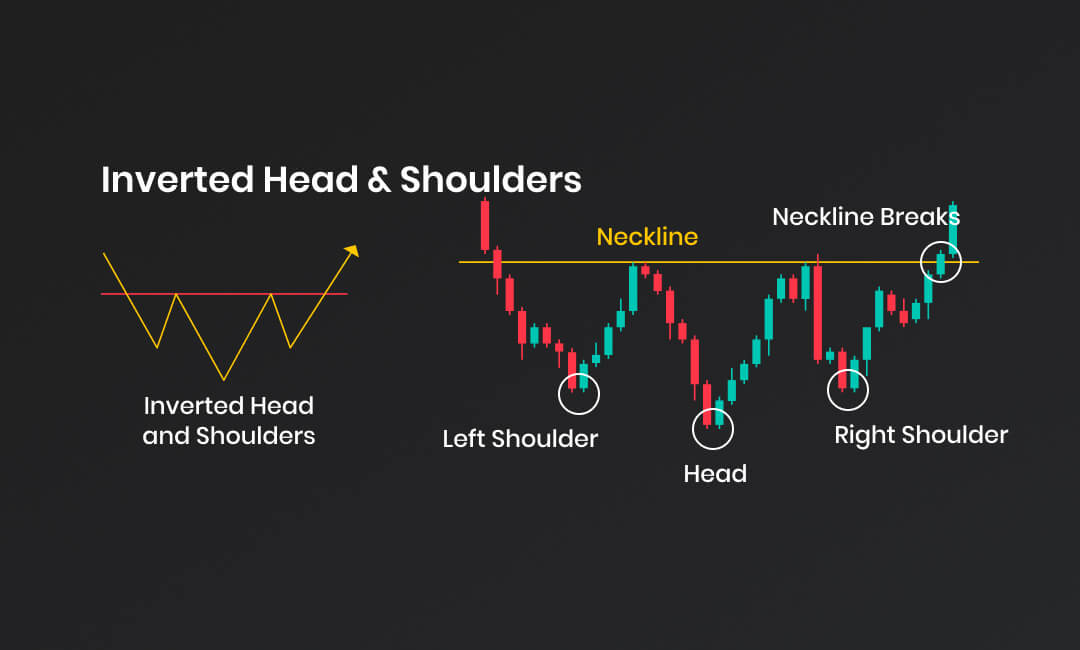
The inverted version features three troughs: a deep “head” between two higher “shoulders.” A breakout above the neckline suggests that bearish momentum has ended and a bullish trend is beginning.
Continuation Patterns
Continuation patterns suggest that the existing trend is likely to resume after a pause. These include rectangles, triangles, flags, pennants, and cup-and-handle formations.
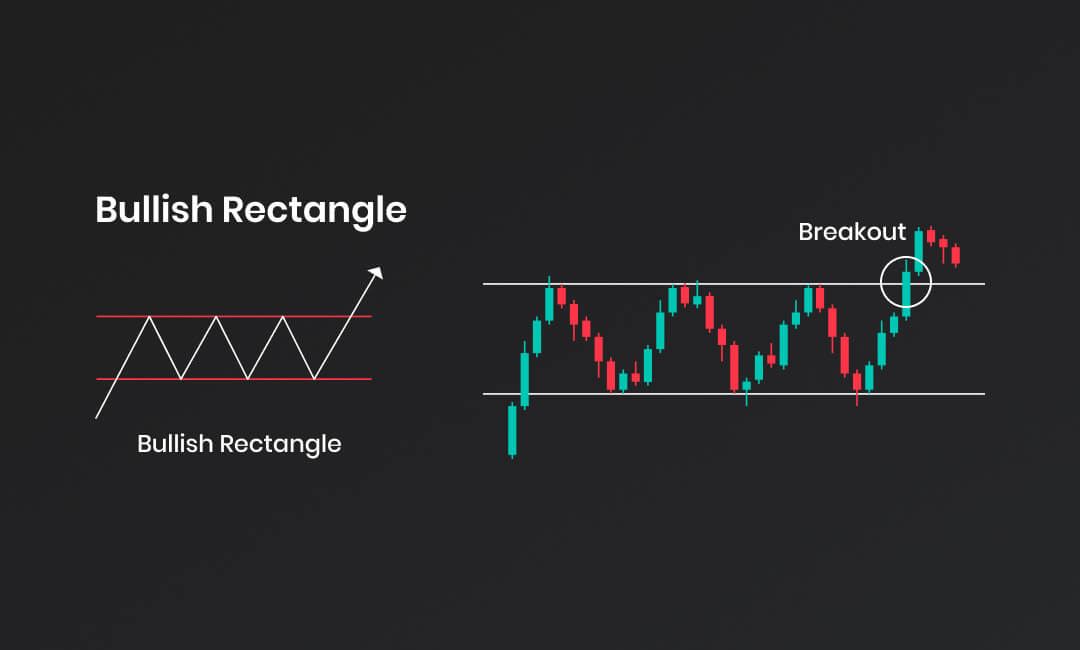
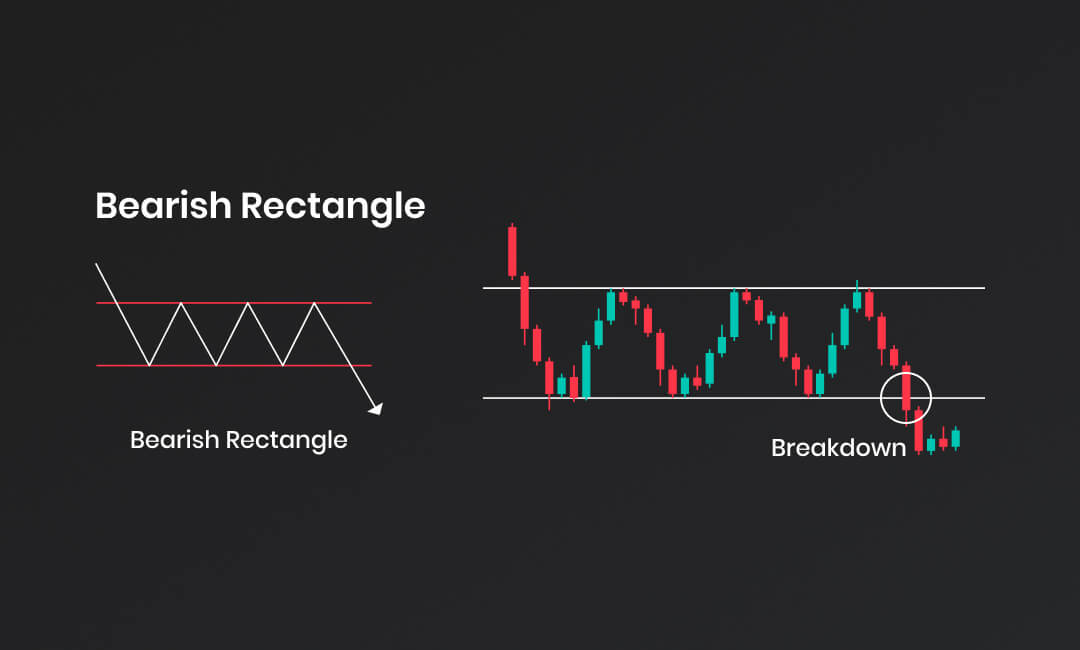
Bearish/Bullish Rectangle
Rectangles are formed when price moves between parallel support and resistance levels. A downside breakout signals continuation of a bearish trend, while an upside breakout signals continuation of a bullish one.
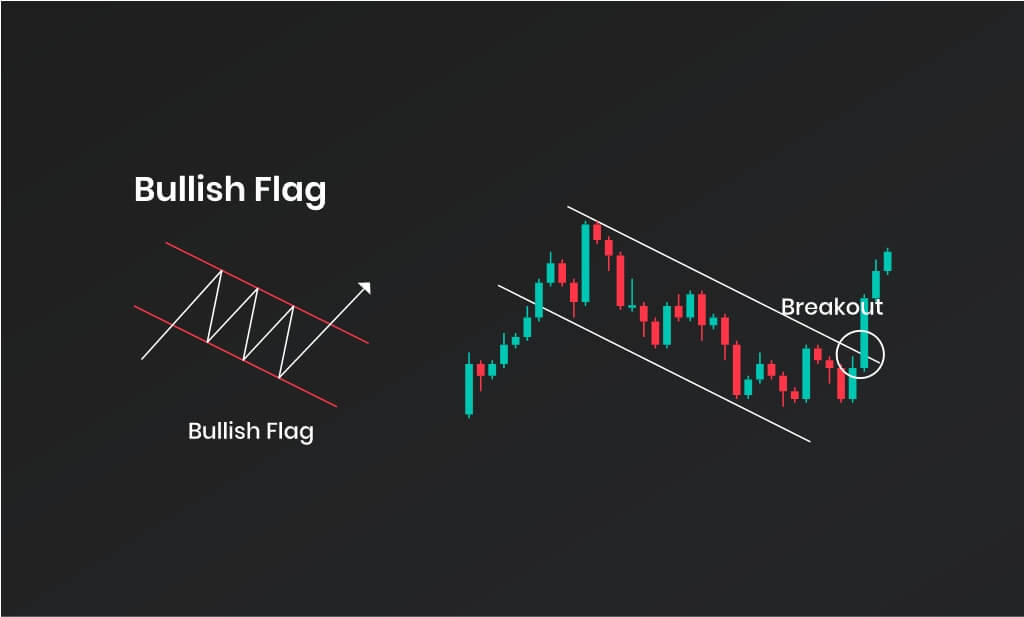
Bearish/Bullish Flag
Flags appear after sharp moves. A bearish flag forms following a steep decline, consolidating in a small channel before breaking lower again. A bullish flag forms after a sharp rise, consolidating before breaking higher. In both cases, the flagpole measures the expected continuation move.
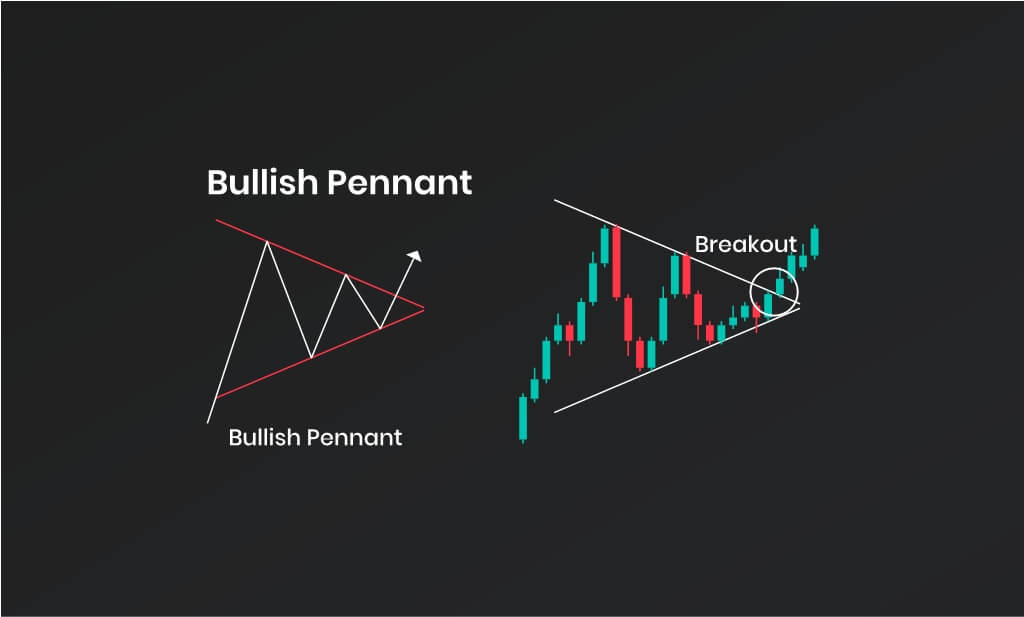
Bearish/Bullish Pennant
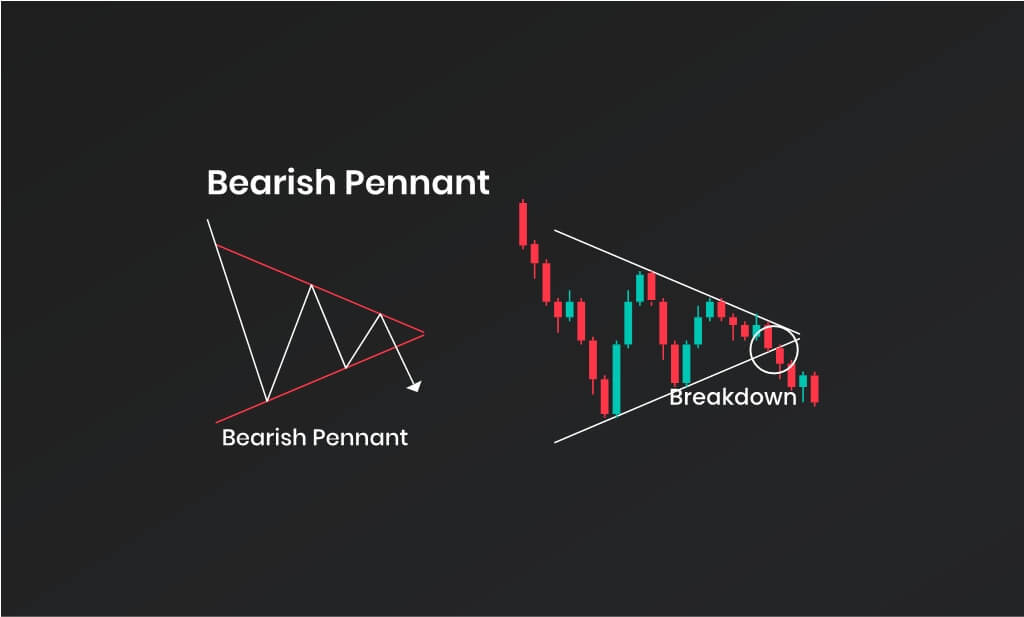
Pennants are similar to flags but take the shape of small triangles. A bearish pennant follows a steep drop and continues downward after consolidation. A bullish pennant forms during an uptrend and resumes upward after a breakout.
Cup & Handle / Inverted Cup & Handle
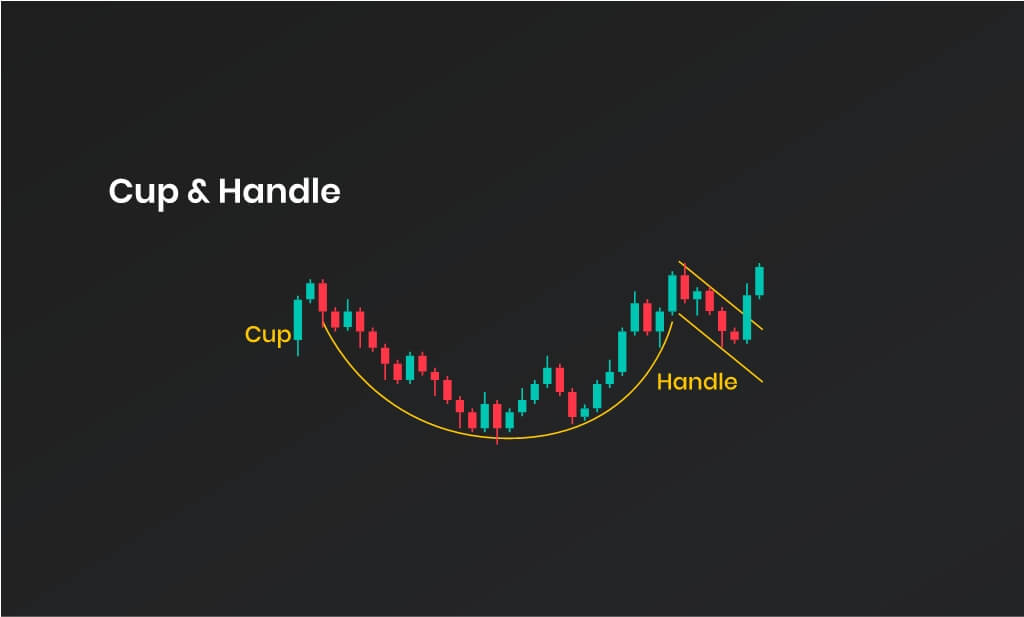
A cup-and-handle resembles a rounded bottom followed by a small pullback (the handle). A breakout above the handle signals continuation of the bullish trend.
The inverted version signals bearish continuation: after a rounded top and small pullback, a breakdown through support suggests further downside.
Bilateral/Neutral Patterns
Symmetrical Triangle
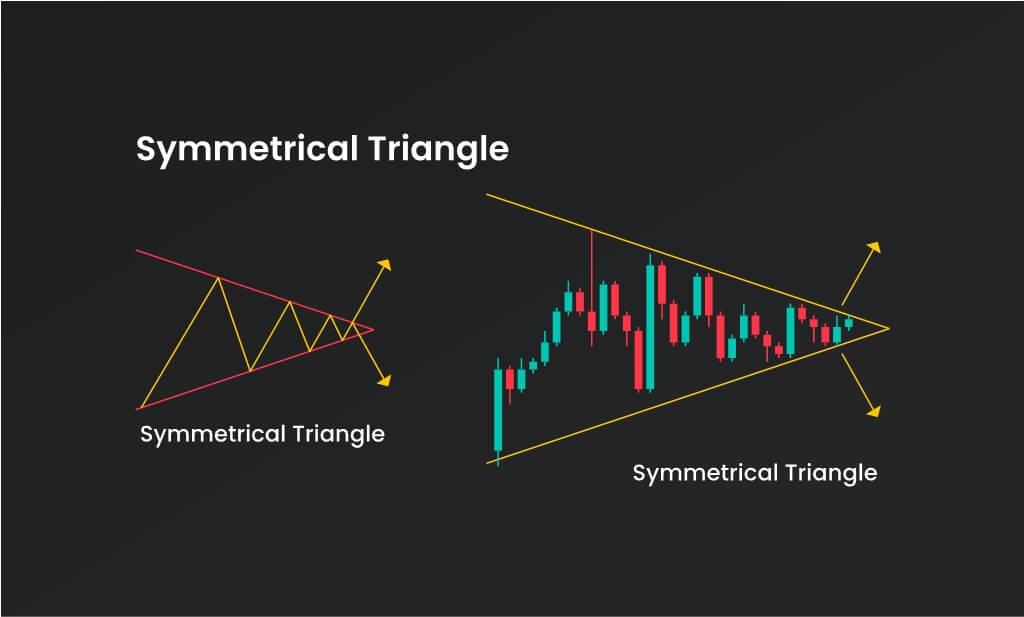
This pattern forms as price consolidates within converging trend lines. It is considered neutral, as the breakout can occur in either direction. Traders often wait for confirmation before entering positions.
Rising Wedge
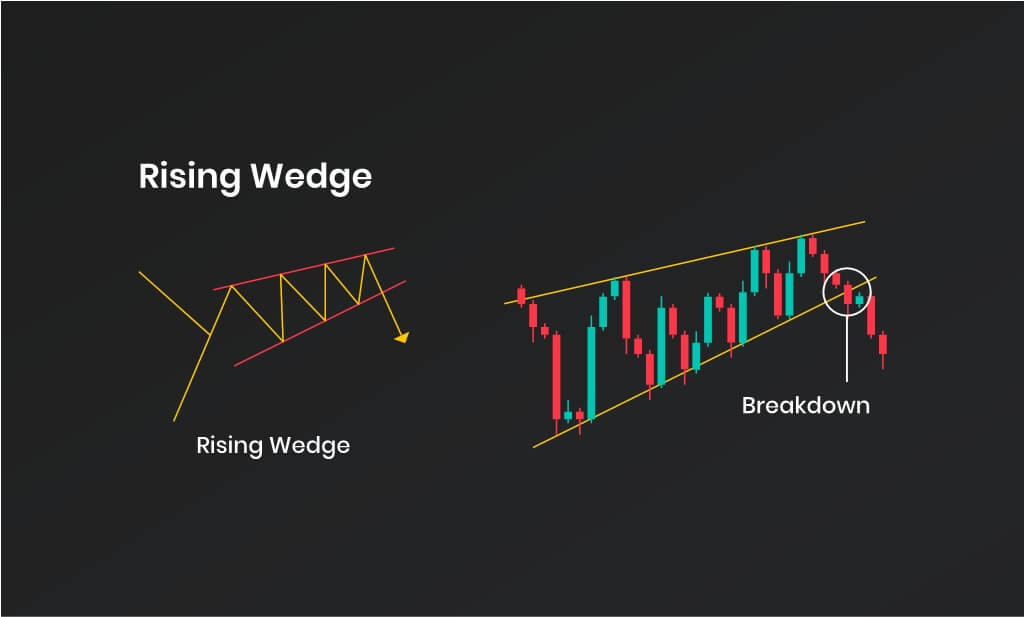
A rising wedge features two upward-sloping lines. It often signals weakening momentum and a bearish reversal once price breaks below support.
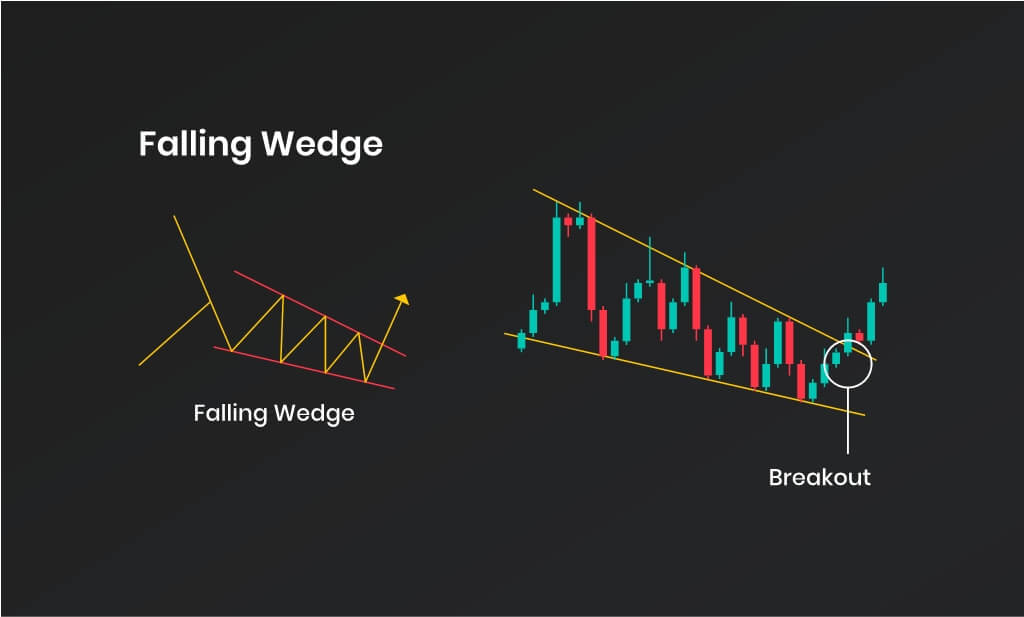
Falling Wedge
A falling wedge has two downward-sloping lines that converge. It suggests bearish momentum is fading, and a breakout above resistance confirms a bullish reversal.
Final Words
Some traders dismiss chart patterns, while others swear by them. They provide early signals of possible price movement but should never be the sole basis for trading decisions. Clear criteria supported by both technical and fundamental analysis are essential. Trade safe!
All information provided on this site is intended solely for educational purposes related to trading on financial markets and does not serve in any way as a specific investment recommendation, business recommendation, investment opportunity analysis or similar general recommendation regarding the trading of investment instruments. FTMO only provides services of simulated trading and educational tools for traders. The information on this site is not directed at residents in any country or jurisdiction where such distribution or use would be contrary to local laws or regulations. FTMO companies do not act as a broker and do not accept any deposits. This article is for informational purposes only, and some information may not reflect the current service offering or product features. Please always verify the latest terms on the official product pages.
About FTMO
FTMO developed a unique Evaluation Process to find trading talents. Upon successful completion you can get an FTMO Rewards Account with a balance of up to $200,000 in simulated funds. Click here to learn more about how it works.


